close
Lesson 4 Integrate Power BI
In Lesson 3
, we used sample code connect to NAS .In this lesson, you will learn how yo use Power BI visualize sensor data that NAS recive in real-time.
There are four parts:
A: Get your first Power BI account
B: Setup your streaming dataset API
C: Configure Node-RED’s nodes in IoT application
D: Add tile to display real-time data
Part A: Get your first Power BI account
- Sign up for a free PowerBI account at https://powerbi.microsoft.com/en-us/

After registering, you will see the following page, you could click "skip for now " to start create dataset.

Part B: Setup your streaming dataset API
Create “Datasets”
- Click “Create” in scrren upper right corner
- And then click “Streming dataset”

Select “API”, and click “Next”.
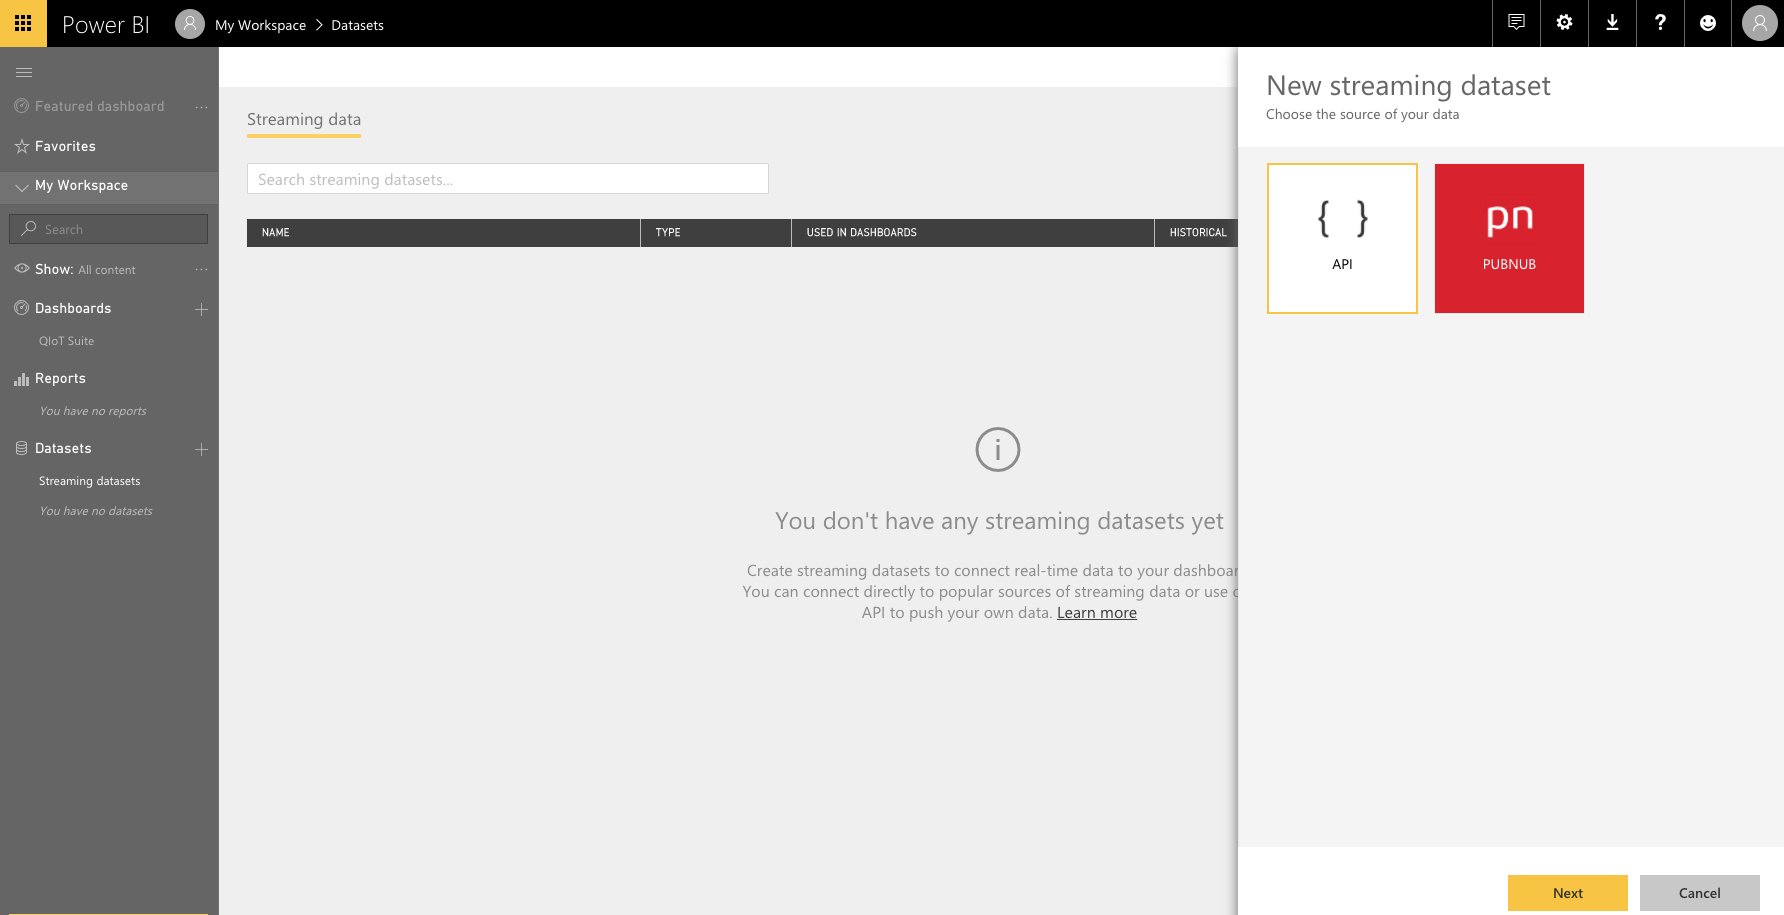
Define your values from stream, and you will get a JSON result in the textbox. We will use this JSON code to push data to the IoT application. Click "Create" to finish.

Once you create your data stream, you get a REST API URL which IoT applications can call using POST requests to push your live data to the streaming data dataset you created.

Part C: Configure Node-RED’s nodes in IoT application
Create an IoT application in QIoT Suite. The following is your first Node-RED flow, and then you can start creating your own IoT flow. You can learn more about Node-RED at https://nodered.org/

Before you start pushing live data to Power BI. We need a "function" node to convert IoT data to a streaming data dataset. Here you can replace msg.payload to your JSON dataset.
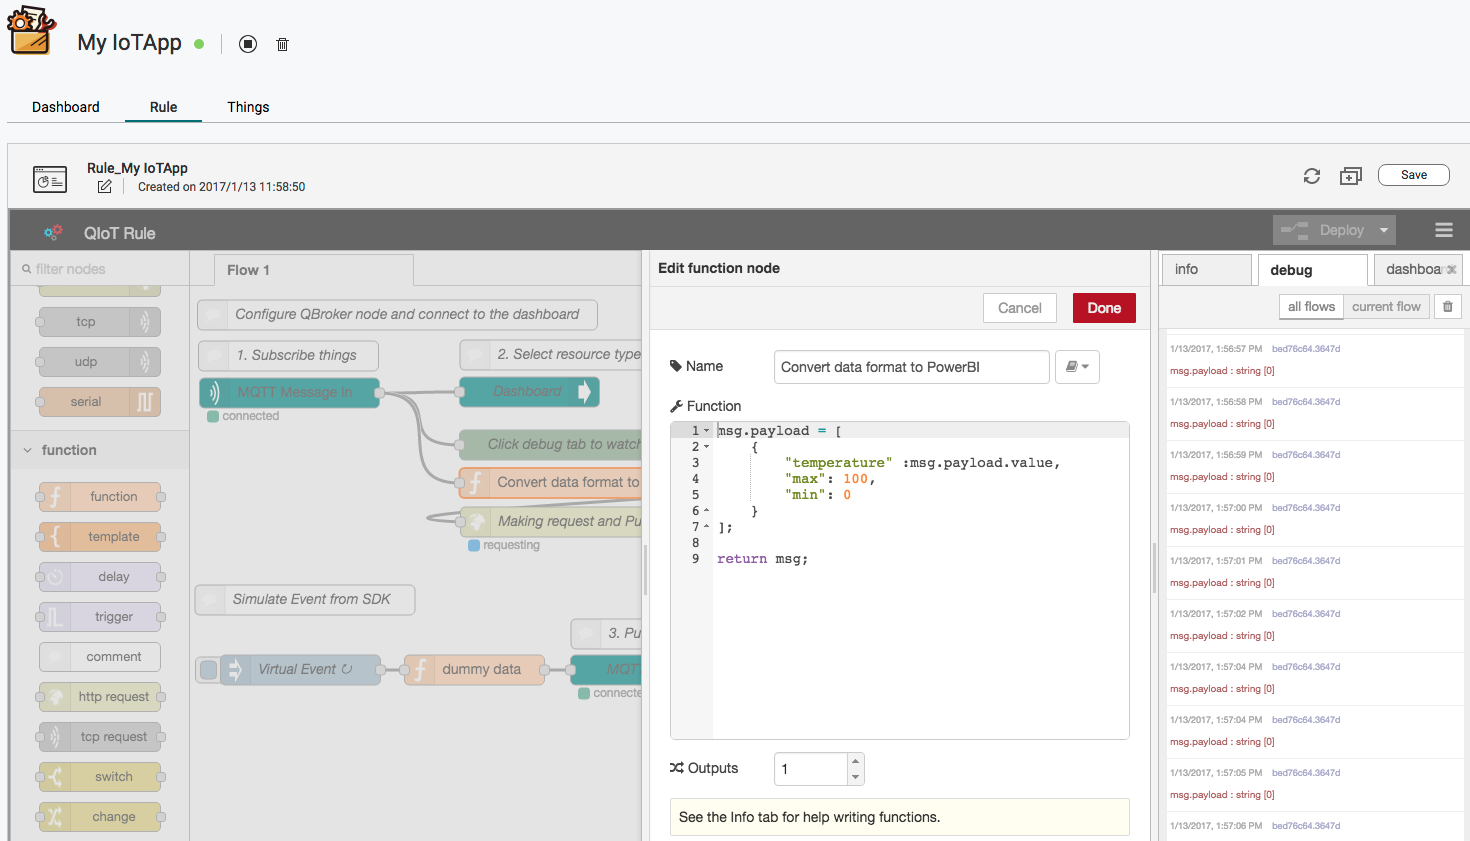
- Function code as following:
msg.payload=[{

"temp":msg.payload.value,

"max":100,

"min":0

}]

return msg;
We need an "http request" node to help us to push live data to Power BI. Just drag and drop the "http request" node and connect to the tail of the "function" node.

Copy and paste the REST API URL that you got from the Power BI console, and set http method to POST. Click "Deploy" to save changes
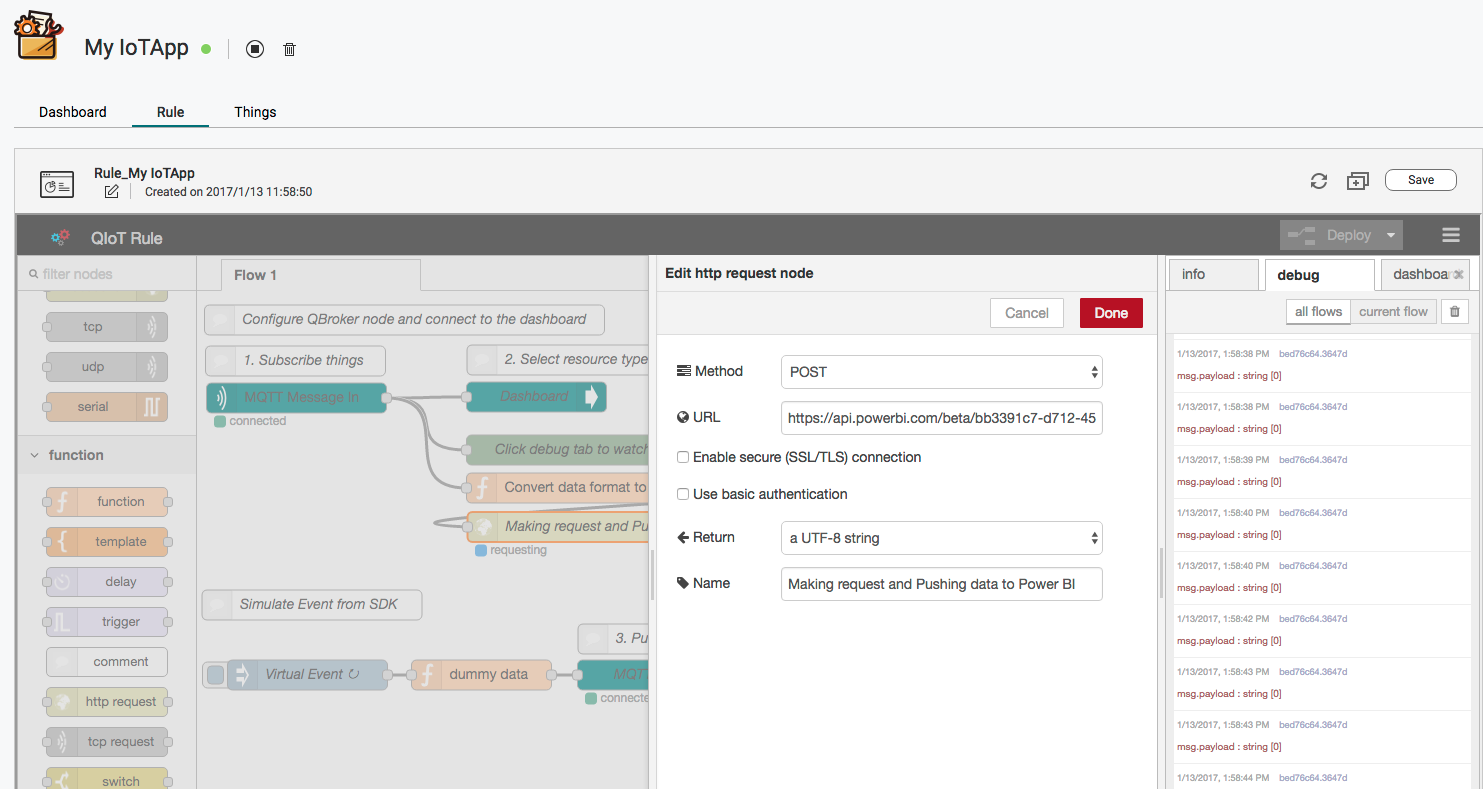
Your Node-RED flow will look like below

Part D: Add tile to display real-time data
Create “Dashboard”
- Click “Create” in scrren upper right corner
- And then click “Dashboard”
- Enter dashboard’s name,and click “Create” to complete create dashboard.


- Click “Add tile” in screen upper right corner

Select “CUSTOM STREAMING DATA” and click “Next”.
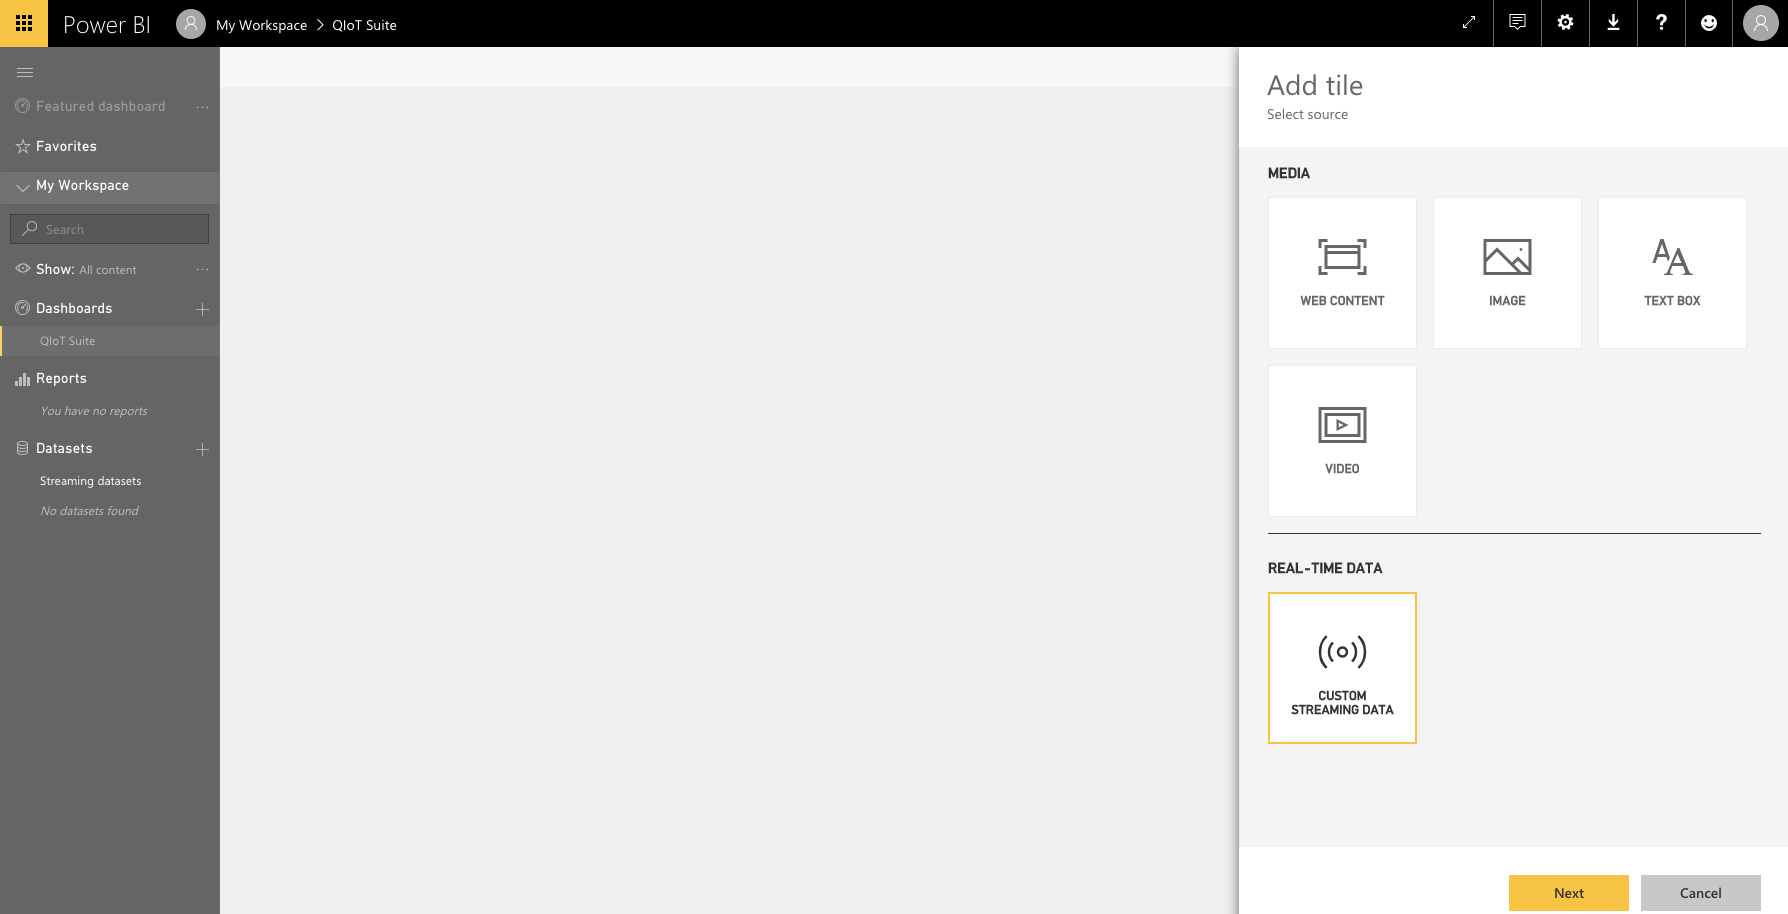
Select datasets and click “Next” .

- Select visualization type (e.g.,gauge),and set value,min,and max value.

You will have a streaming dataset to work with, and you can get a real time gauge that looks as following.

Please visit QNAP github for QIoT Suite Lite sample code
"QNAP-Github"
全站熱搜


 留言列表
留言列表
 {{ article.title }}